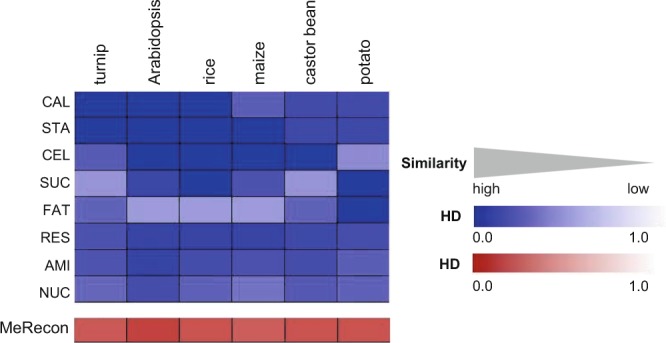
Figure 6.

The normalized Hamming distance (HD) estimates the distance of pathway topology through enzymatic reactions between cassava (MeRecon) and the other six model plants represented as heatmap in blue color. CAL - Calvin cycle, SUC - sucrose biosynthesis, STA - starch biosynthesis, RES - respiration, AMI - amino acid biosynthesis, CEL - cell wall biosynthesis, FAT - fatty acid biosynthesis, and NUC - nucleotide biosynthesis. The heatmap in red represents the HD scores that contrasted the topology of the overall carbon assimilation pathway of cassava (MeRecon) with the other plant species.
