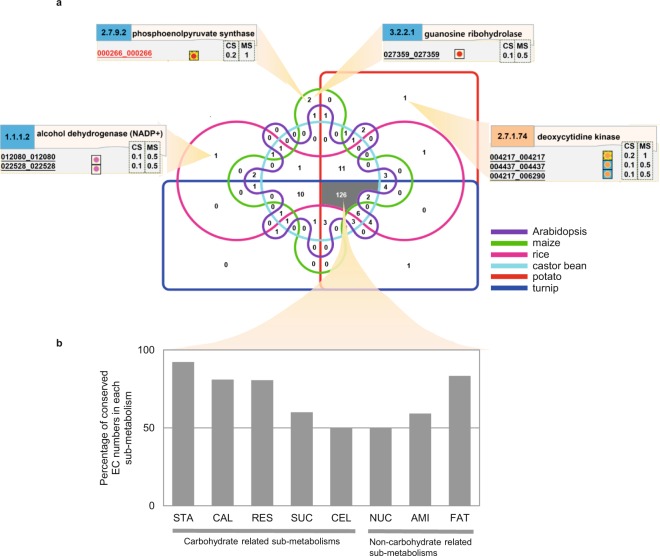
Figure 7.
Conservation of metabolic functions of cassava carbon assimilation pathway based on EC numbers (enzymes) with respect to the representative plant species (a). The distribution of 126 EC numbers that are conserved across six representative plant species is shown for each sub-metabolism as gray bar (b). STA - starch biosynthesis, CAL - Calvin cycle, RES - respiration, SUC - sucrose biosynthesis, CEL - cell wall biosynthesis, NUC - nucleotide biosynthesis, AMI - amino acid biosynthesis, and FAT - fatty acid biosynthesis.

