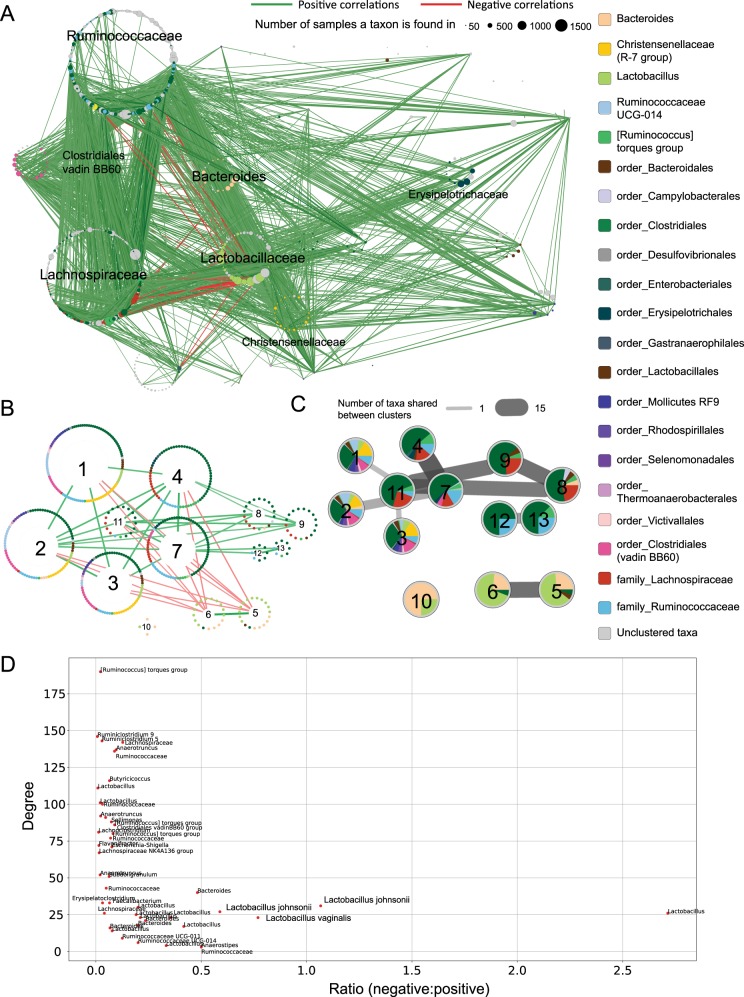
Fig. 2.
Co-occurrence network and analysis of OTUs chicken cecal samples. a Co-occurrence network built with SparCC with nodes representing taxa (as defined by OTUs—see Methods) and edges representing positive (green) or negative (red) associations of co-occurrence across samples. Thickness and opacity of the edges represent the strength of the correlation and node sizes represent the number of samples that contain those taxa. Taxa are grouped by family, with major families labelled. Correlations with an absolute value smaller than 0.3 are not shown. Colour of nodes indicate taxon (see legend), taxa that could not be resolved at the level of genus are noted with preceding order or family. b Clustered co-occurrence network with only the interactions between clusters shown. Nodes, representing taxa, are organized into a circular layout according to cluster membership. Each cluster is assigned a number for reference. c Number of taxa shared across clusters. Here each cluster is depicted as a pie chart with sectors indicating proportion of each taxon. Cluster numbering is consistent with (b). Edges between clusters indicate that there are taxa shared between clusters, thicker and darker edges represent more shared taxa. d Scatter plot of ratio of negative to positive interactions against degree for every taxon. Taxonomic labels down to the species level were obtained from sequence similarity searches against partitions of the NCBI’s non-redundant nucleotide database (see Supplemental Information)

