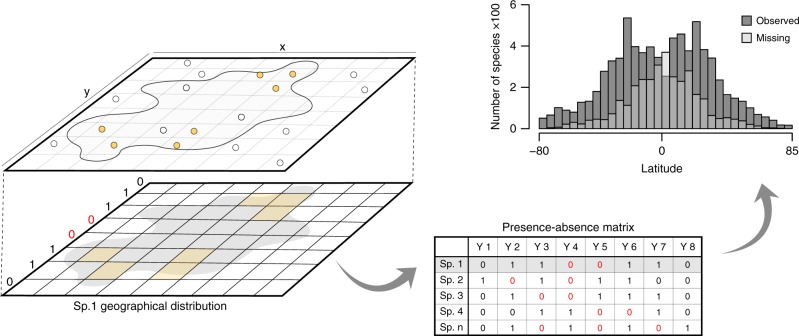
Fig. 1.
From species sampling to spatial richness pattern. The lack of occurrence records of a species in a location (white dots) may be caused by its true absence (geographic distribution) or by poor sampling (artefactual absence). In this example, the irregular polygon in the extruded map represents the true distribution of a species. Researchers only have access to occurrence records (yellow dots), which are then mapped in discrete grid cells (yellow cells, lower map), which may contain discontinuities in the estimated species range if the inventory is not sufficient. The observed presence (1) and absence (0) of species in latitudinal bands are recorded along the left margin of the lower map, in which red zeros indicate the spatial gaps in the latitudinal distribution of the species. By compiling occurrence data for multiple species, we can quantify not only the richness pattern but also the frequency of spatial gaps (note that colours are mixed where histograms overlap; histogram based on real Ophiuroidea data)

