
Fig. 2.
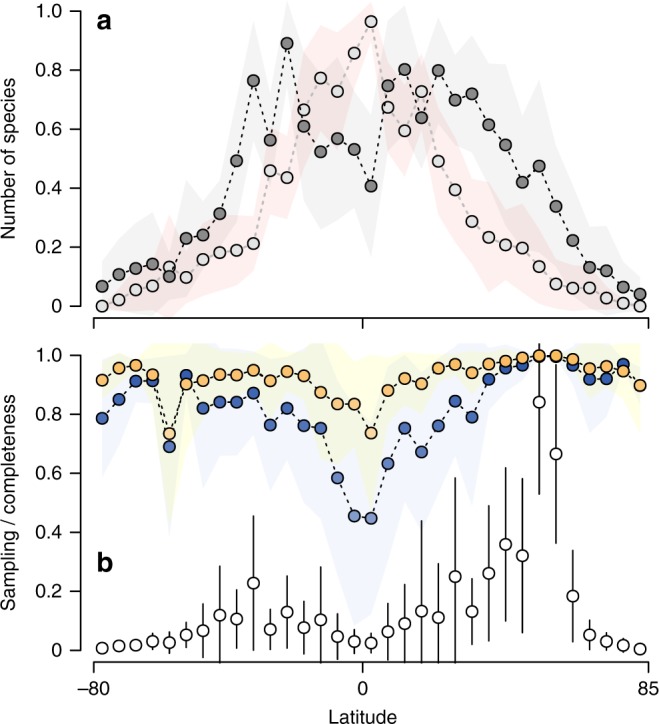
Patterns of latitudinal variation in species richness, spatial gaps and sampling efficiency for marine taxa. Circles represent mean values based on results of 10 taxonomic groups. Shaded area and vertical bars represent standard deviation (s.d.). Data were standardised by the maximum observed value to range between 0 and 1. a Mean (± s.d.) latitudinal variation in number of observed species (dark grey circles) and number of missing species (light grey circles). Notice that the number of missing species exceeds the number of recorded species at lower latitudes. b Mean (± s.d.) latitudinal variation in sampling effort (number of unique sampling events; open circles) and two estimates of inventory completeness (sample coverage: orange circles; species accumulation curve: dark blue circles)