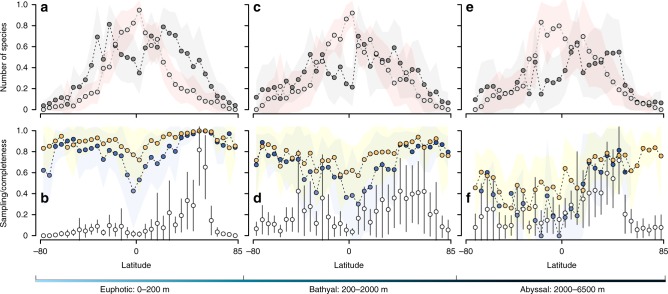
Fig. 3.
Patterns of latitudinal variation in species richness, spatial gaps and sampling efficiency at three different depth strata. Symbols and colors as in Fig. 2. a, c, e Mean (± s.d.) latitudinal variation in number of observed species and number of missing species at the euphotic, bathyal and abyssal strata. b, d, f Mean (± s.d.) latitudinal variation in sampling effort (number of unique sampling events) and two estimates of inventory completeness (sample coverage and species accumulation curve) at the euphotic, bathyal and abyssal strata. In all three depth strata the sampling effort decrease at the equator, reducing the level of completeness, number of observed species and increasing the number of spatial gaps

