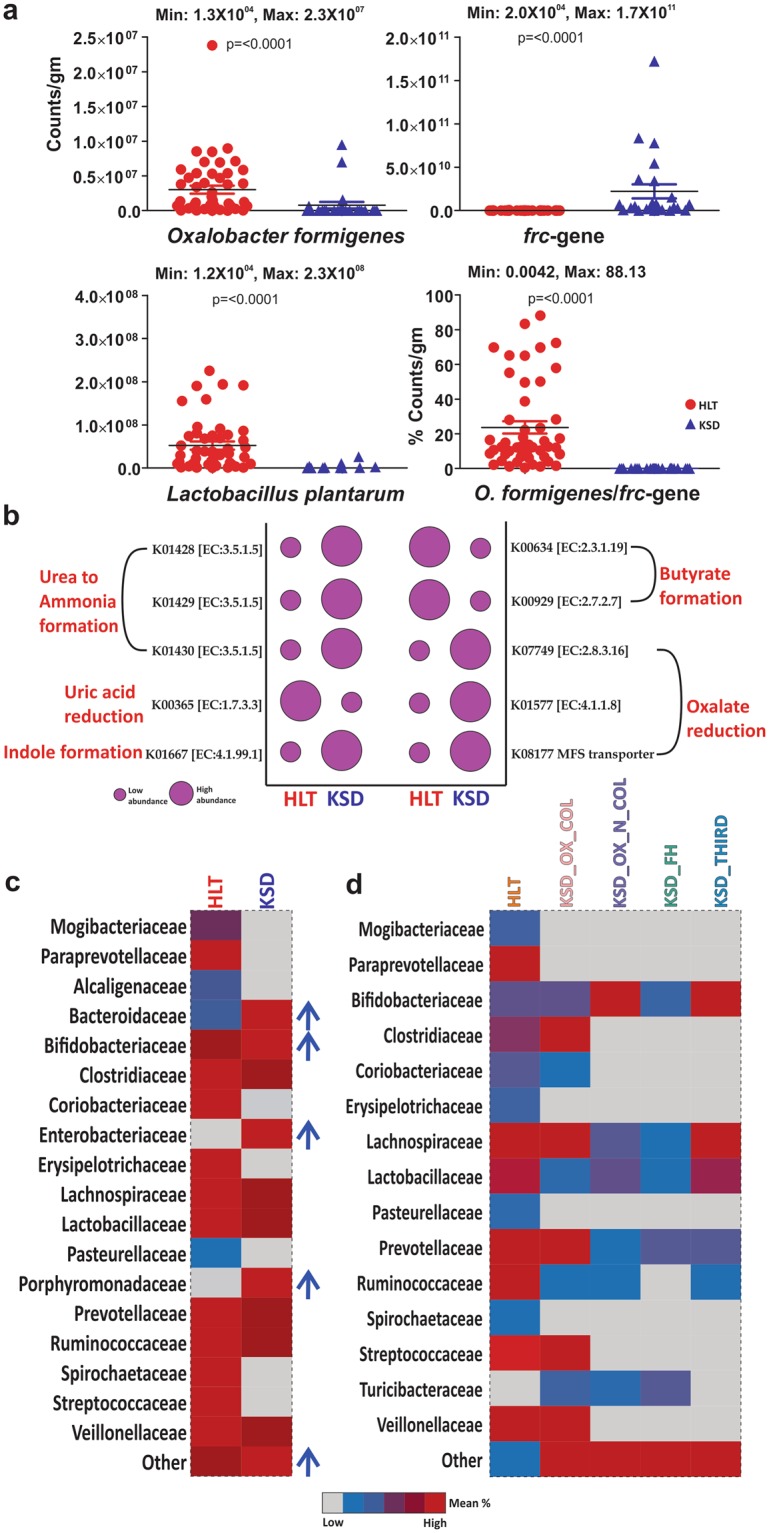
Figure 1.

Comparatives in eubacterial colonization status of HLT and KSD subjects. (a) qPCR based quantitative estimation of Oxalobacter formigenes, total OMBS diversity (through frc-gene) and Lactobacillus plantarum in HLT and KSD (n = 72). (b) Evaluation of specific metabolism capacities of eubacteria, and respective KEGG Orthology for the enzymes involved in metabolic phenotype according to the predicted metagenome observed in HLT and KSD. (c) Heat map showing family level differences in HLT and different groups in KSD subjects. The data used to generate these graphs has been partially adopted from Suryavanshi et al.11.
