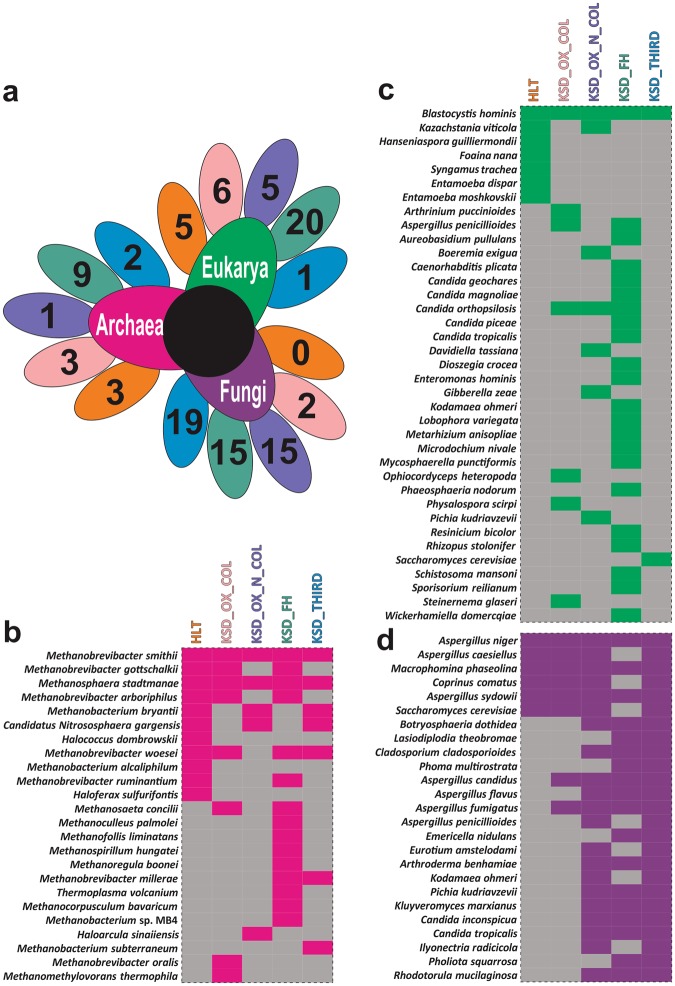
Figure 3.
Compositional differences in eubacteria diversity in study subpopulations (HLT = 07 and KSD = 07). Clustering pattern of tested subpopulation through (a). PCR-DGGE fingerprint analysis in UPGMA algorithm, (b). PCoA plot and (c). IKF values on scattered plot derived from K-Shuff algorithm. (d) Species level diversity differences observed in HLT and KSD subjects, whereas shared species with significant difference (Welch’s test p <= 0.05) were annotated in bubble plot.

