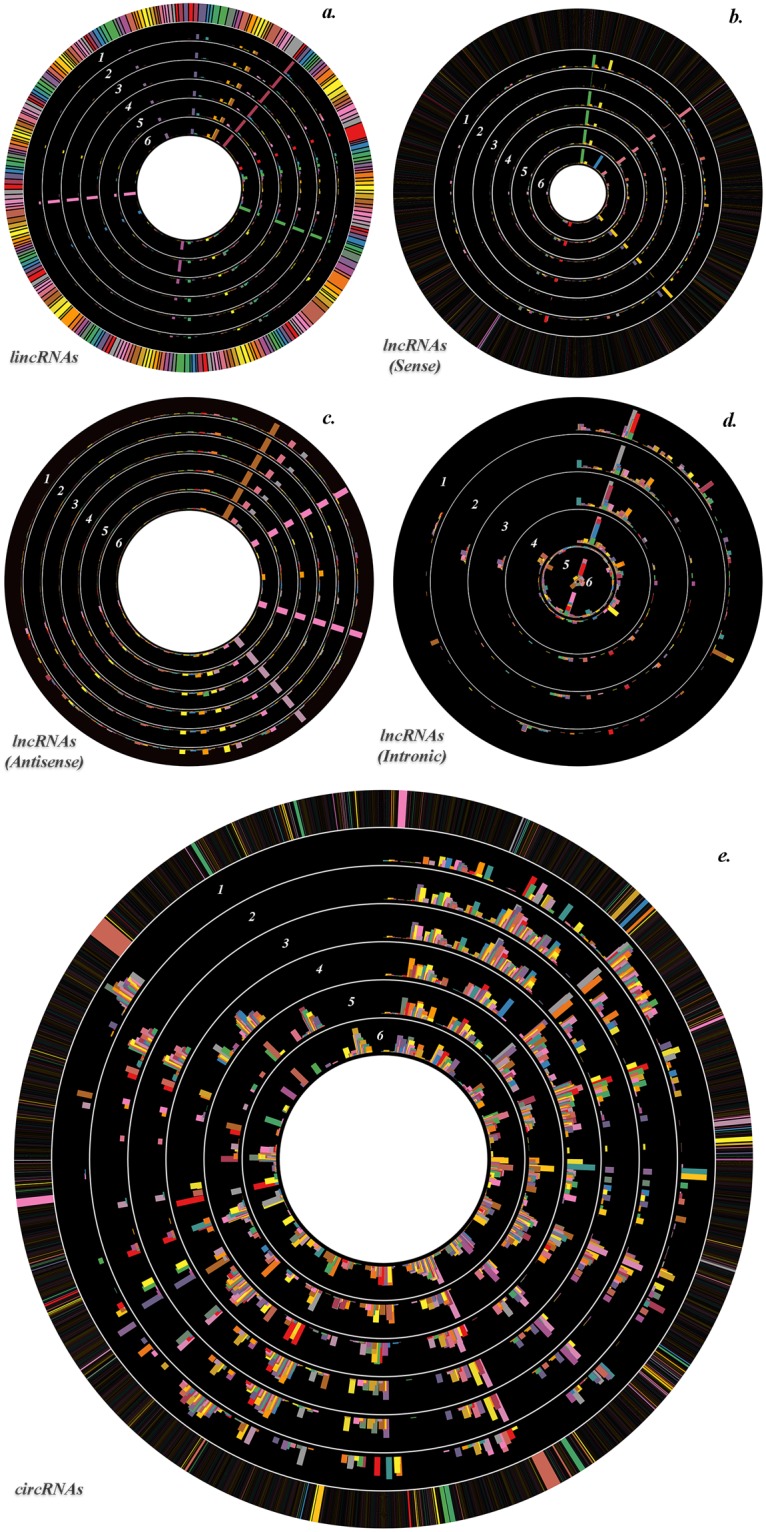
Figure 2.

Circular plot of most altered ncRNAs FCs. The expression profile of analyzed lincRNAs (a), sense lncRNAs (b), antisense lncRNAs (c), intronic lncRNAs (d) and circRNAs (e) with 0 < FC < 1 (formerly FC < −2 in the manuscript) or FC > +2 between treated and untreated RPE samples was visualized in Circos. All FCs are log2 transformed. The expression profile of each considered time point is represented as a single circle, and FCs of the individual ncRNAs are proportional to histogram bar height. The time point–related order of the ncRNA expression profile samples is from the outer circle to the inside, as depicted by inserted numbers. 1. 0 h vs 1 h – Treated. 2. 0 h vs 1 h – Untreated. 3. 1 h (Treated vs Untreated). 4. 2 h (Treated vs Untreated). 5. 4 h (Treated vs Untreated). 6. 6 h (Treated vs Untreated). A clustering of several groups of ncRNAs which follow the same trend through all considered time points is evident.
