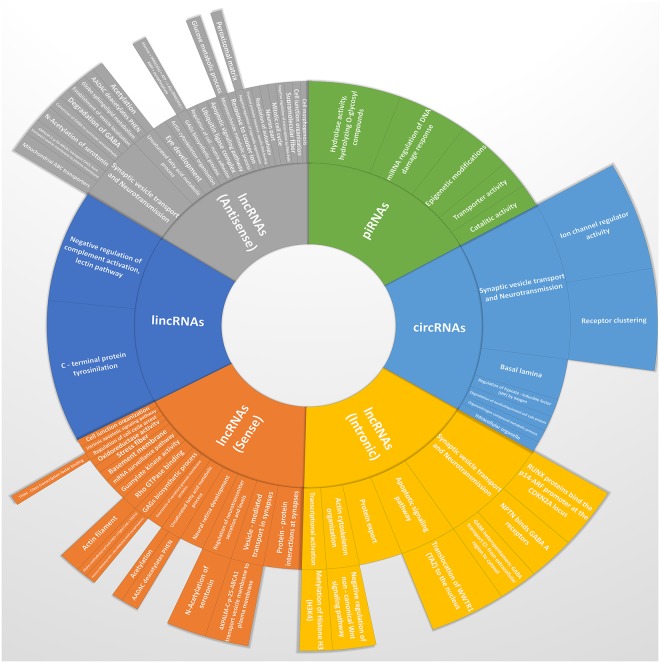
Figure 5.
Sunburst chart of most altered ncRNAs. This type of visualization shows hierarchy through a series of rings, that are sliced for each category node. Each ring corresponds to a GO level in the hierarchy, with the central circle representing the root node made of analyzed ncRNA categories, and the hierarchy moving outwards from it. The angle of each slice is either divided equally under its parent node or made proportional to the percentage of most altered ncRNAs involved in each GO categories. Different colors highlight hierarchal groupings, while font dimension is proportional to up–regulated pathway and sub–pathways (bigger font) and down–regulated ones (smaller font).

