
Fig. 3.
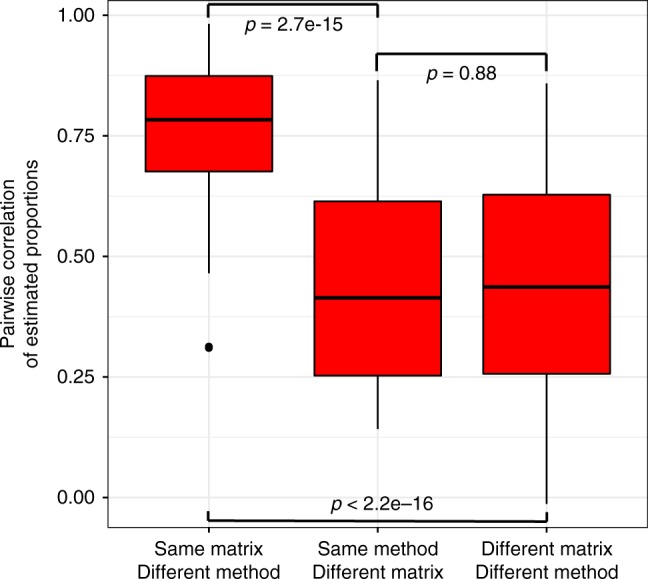
Deconvolution concordance by matrix and method. Boxplots represent the distribution of pairwise correlation coefficients between estimated proportions for all matrices and deconvolution methods. Center lines correspond to the median value of each box and the lower and upper bounds of each box correspond to their first and the third quartiles, respectively. Comparisons were divided in (1) pairs with the same signature matrix but run with different methods, (2) pairs with different signature matrices but run using the same method, and (3) pairs where both matrix and method were different. Significance analysis was performed using the Wilcoxon’s paired rank sum test