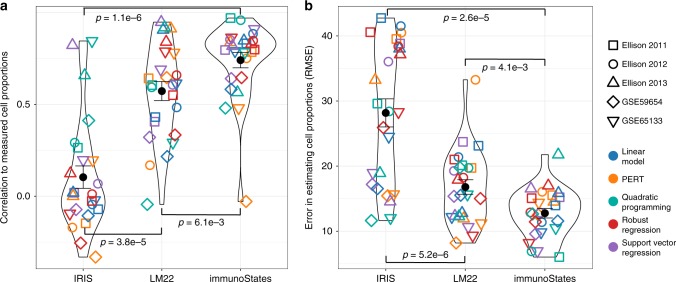
Fig. 4.
Correlation with measured cell proportions across 402 human blood samples. a Correlation between measured cell proportions and deconvolution estimates in five different human sample cohorts (denoted by different shapes) across different deconvolution methods (denoted by different colors) using IRIS, LM22, and immunoStates (x-axis). Correlation is measured by Pearson’s correlation coefficient. Center dot represents mean value for each violin plot. Error bars represent standard error of the mean. b Same as in a for RMSE between measured and estimated cell proportions. Significance analysis was performed using the Wilcoxon’s paired rank sum test

