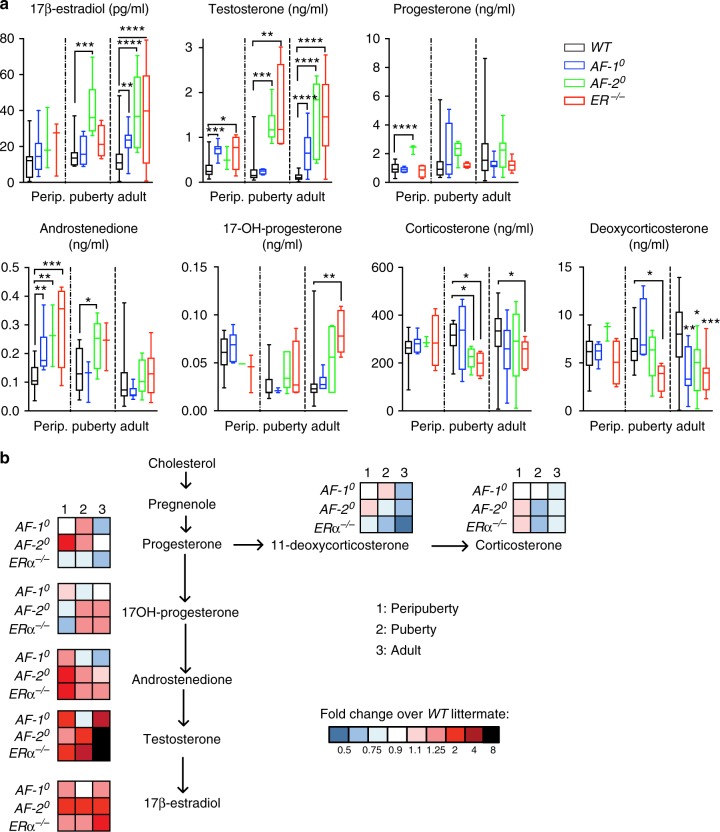
Fig. 2.
Steroid hormone levels in ERα AF-10, ERα AF-20 and ERα−/− mice. a Box plots showing plasma levels of 17-β-estradiol, testosterone, progesterone, androstenedione, 17-OH-progesterone, corticosterone and deoxycorticosterone determined by LC/MS measured in peripubertal (3-week old), pubertal (4- to 7-week old) and adult (>8-week old) WT, AF-10, AF-20 and ERα−/− females (n = 3–25). Horizontal lines outside the boxes depict minimum and maximum values, upper and lower borders of the boxes represent lower and upper quartiles, and the line inside the box identifies the median. Unpaired, Mann–Whitney test. b Mean serum levels of the different steroids (shown in a) were plotted relative to average levels in WT littermates in the context of major biosynthetic pathways. Colour code represents fold changes over levels in the WT littermates

