Fig. 6.
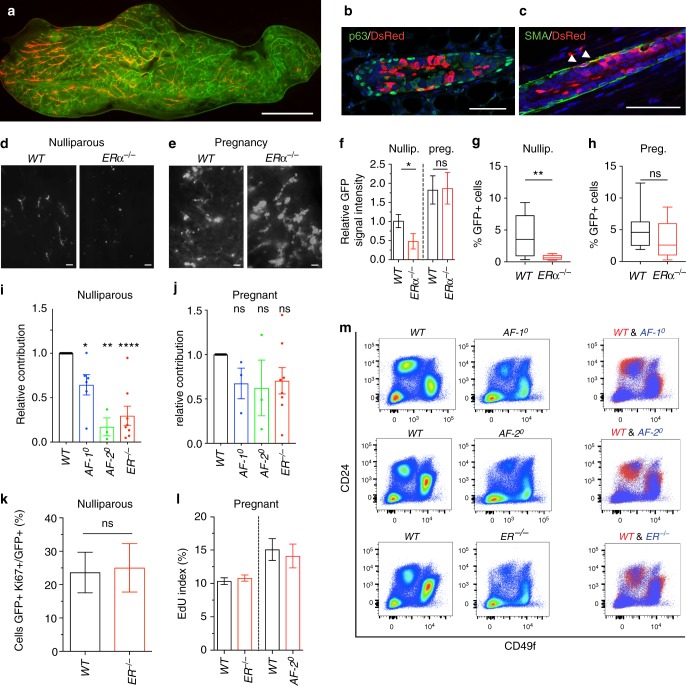
Intraductal engraftment of WT and ERα−/− MECs. a Fluorescence stereomicrograph of NSG.GFP+ mammary gland 5 days after intraductal injection of WT.DsRed+ MECs, representative of nine successfully injected glands. Scale bar; 1 mm. b, c Double immunofluorescence with anti-P63 and anti-RFP antibodies b or anti-αSma and anti-RFP antibodies c counterstained with DAPI. Scale bars; 50 μm. Representative pictures of injected glands from three females. d, e Fluorescence stereomicrographs of contralateral mammary glands 5 days after intraductal injection with WT.GFP+ or ERα−/−.GFP+ in nulliparous d or day 16–18 pregnant host (e). Scale bars; 500 μm. f Bar plot showing relative GFP signal intensity in contralateral glands injected with WT.GFP+ or ERα−/−.GFP+ cells in nulliparous and pregnant recipients, (n = 3–6; mean ± SEM). g, h Box plots showing percentage of GFP+ cells by FACS in nulliparous g and pregnant h hosts (n = 8, 9). Whiskers depict minimum and maximum values, box borders lower and upper quartiles, line inside identifies the median. Student’s paired t test, two-tailed. i, j Bar plots overlying dot plots showing relative contribution of GFP+ cells by FACS of intraductally engrafted glands from nulliparous (i) and pregnant (j) hosts, mean ± SEM. k Box plot showing percentage of GFP and Ki67 double + over total GFP+ cells from contralateral WT.GFP+ or ERα mutant.GFP+ with WT.DsRed+ MECs chimeras in nulliparous recipients 4 weeks after engraftment (n = 3; mean ± SD). l Box plot showing the percentage of GFP and EdU double + over total GFP+ cells from contralateral inguinal mammary glands intraductally engrafted with WT.GFP+ or ERα−/−.GFP+ (left panel) and WT.GFP+ or AF-20.GFP+ MECs (right panel) in pregnant recipients P12.5 (n = 3; mean ± SD). m Representative FACS plots showing CD49f and CD24 expression in Lin- cells from mammary glands of AF-10, AF-20, ERα−/− females and WT littermates. For both box plots, whiskers depict minimum and maximum values, borders of the box represent lower and upper quartiles, and line inside the box identifies the median. Paired two-tailed Student’s t test, *p < 0.05, **p < 0.01, ***p < 0.001, ****p < 0.0001, n.s. not significant

