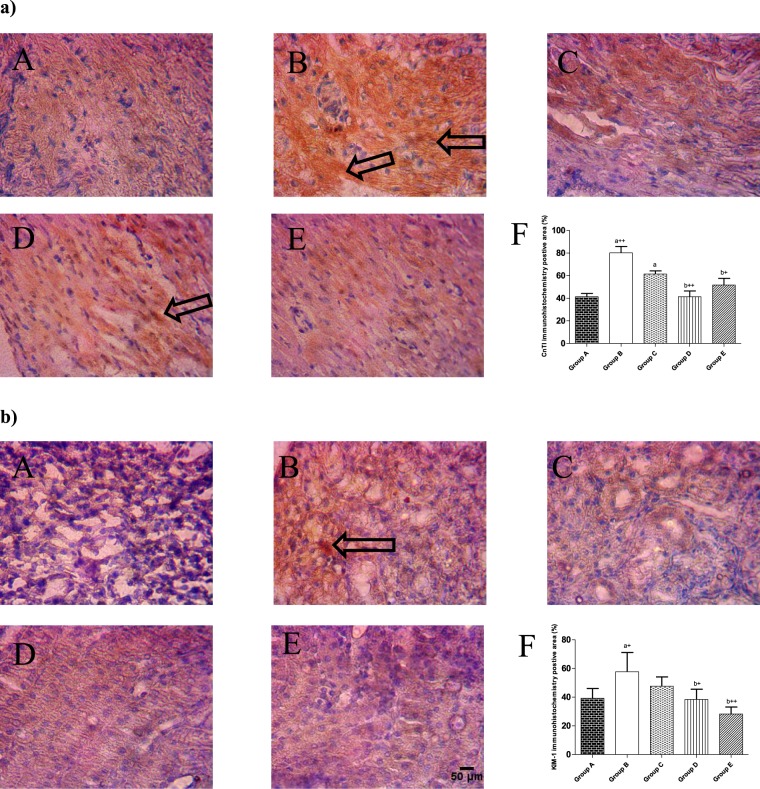
Figure 5.
Immunohistochemical staining patterns of (a) cardiac troponin I (CnTI) in cardiac tissues, (b) Kidney Injury Molecule-1 in kidney tissues. (A) Control; (B) ISO alone; (C) ISO and metoprolol (D) ISO and CurNisNp (10 mg/kg) (E) ISO and CurNisNp (21 mg/kg). (F) Graphical representation of immunohistochemistry positive area. Intensity of staining is indicated with black arrows. Magnification ×100. aP < 0.05 compared with group A; a+P < 0.01 compared with group A; a++P < 0.001 compared with group A; b+P < 0.01 compared with group B; b++P < 0.001 compared with group B.

