Figure 6.
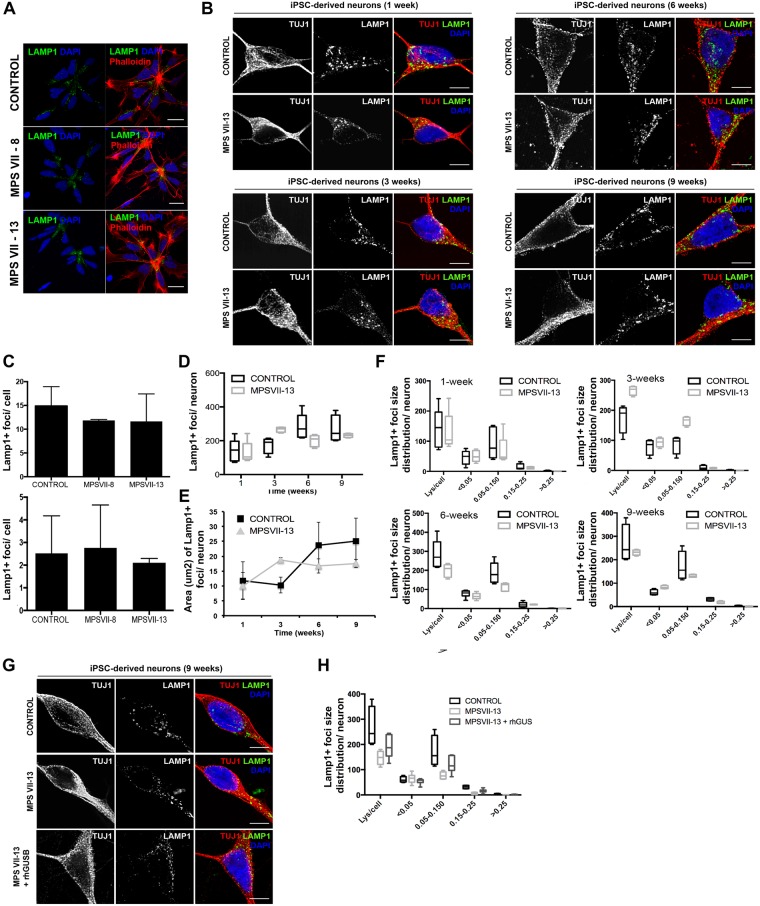
Lysosome structural alteration in MPS VII NPCs and neurons. (A) Immunofluorescence microscopy of control and MPS VII NPC, stained for LAMP1 (green) and DAPI (blue; left panel) or phalloidin (red) and DAPI (blue; right panel); scale bars 20 µm. (B) Immunofluorescence confocal microscopy of control and MPS VII neurons at 1, 3, 6 and 9 weeks of culture, stained for LAMP1 (green), βIII-tubulin (TUJ1, red) and DAPI (blue); scale bars 5 µm. (C) Quantification of acidic vesicles labeled with LysotrackerTM of control and MPS VII NPC, with areas between 0.1–1.2 μm2 per cell (top) and higher than 1.2 μm2 per cell (bottom). Mean LAMP1+ vesicles content (D), area (µm2) (E) and size distribution (F) per neuron for control and MPS VII neurons along culture time. (G) Immunofluorescence confocal microscopy of control, MPS VII neurons and β-gluc-treated MPS VII neurons at 9 weeks of culture, stained for LAMP1 (green), βIII-tubulin (TUJ1, red) and DAPI (blue); scale bars 5 µm. (H) Mean LAMP1+ vesicles size distribution for control, MPS VII neurons and β-gluc-treated MPS VII neurons at 9 weeks of culture.

