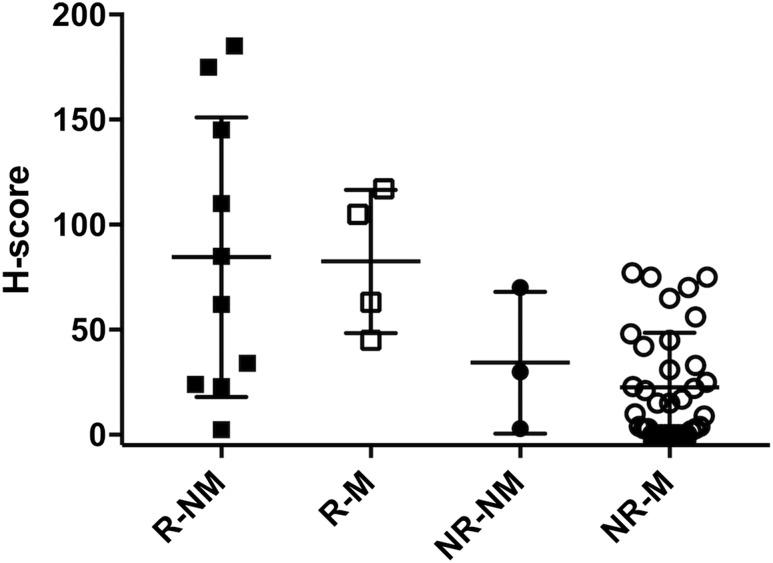
Figure 3.
H-scores in responders and nonresponders by medication use. Subgroup analysis of current medication use at time of surgery, represented as a scatter plot. Error bars represent the group mean ± SD. There was no significant difference in H-scores in the response and no response group with respect to medication use at time of surgery. NR-M, no response on medication; NR-NM, no response not on medication; R-M, response on medication; R-NM, response not on medication.

