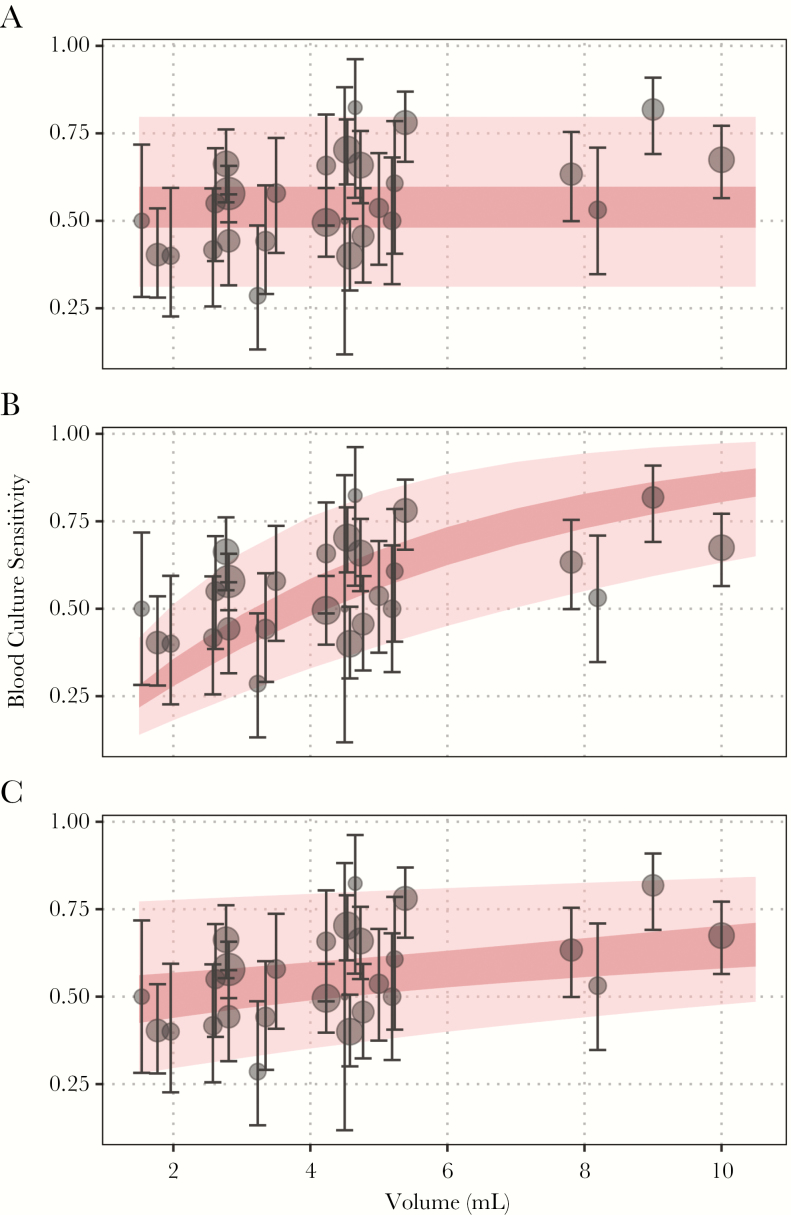
Figure 3.
Relationship between sample volume and model estimates of blood culture sensitivity. The observed blood culture sensitivity among all culture-positive cases is plotted in black (with corresponding 95% confidence intervals), whereas the mean model-predicted blood culture sensitivity is plotted in dark pink. The lighter pink regions correspond to the model-predicted population response. (A) The model assumes no correlation with blood volume; (B) the model assumes sensitivity increases with increasing sample volume and is constrained to be zero for a hypothetical 0-mL sample; (C) the model assumes sensitivity could vary with sample volume and estimates an intercept for a hypothetical 0-mL sample. All models account for heterogeneity between studies using random effects (see Supplement S4.1).

