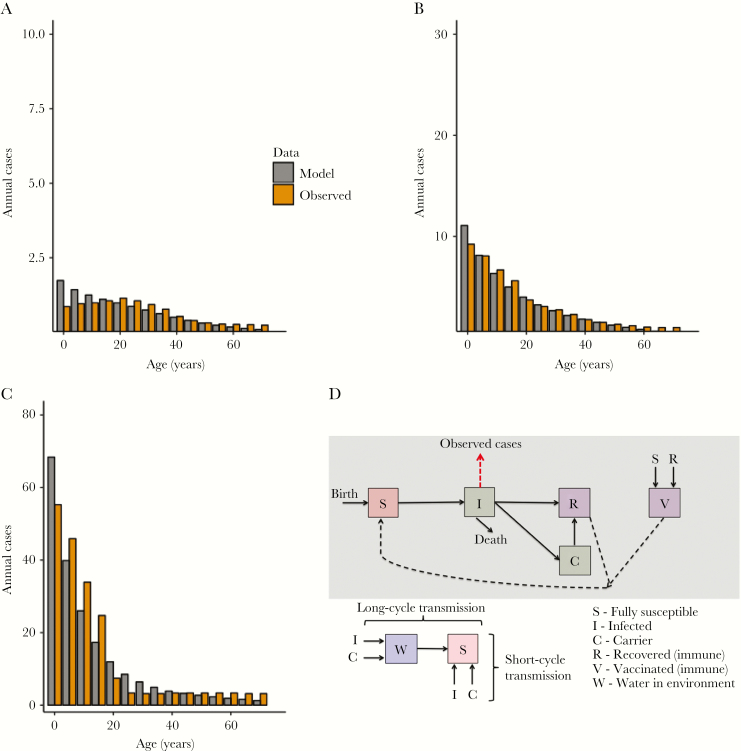
Figure 1.
Calibration of transmission model to low-, moderate-, and high-endemicity settings, with model schematic. The model was calibrated to age-stratified annual incidence in 3 scenarios: low endemicity (10 cases/100000; A), moderate endemicity (50 cases/100000; B), and high endemicity (200 cases/100000; C). The model-predicted (gray) and observed (orange) incidences of typhoid cases are shown by age group. Note the different scale for the y-axis on each plot. D, The model structure for typhoid transmission.

