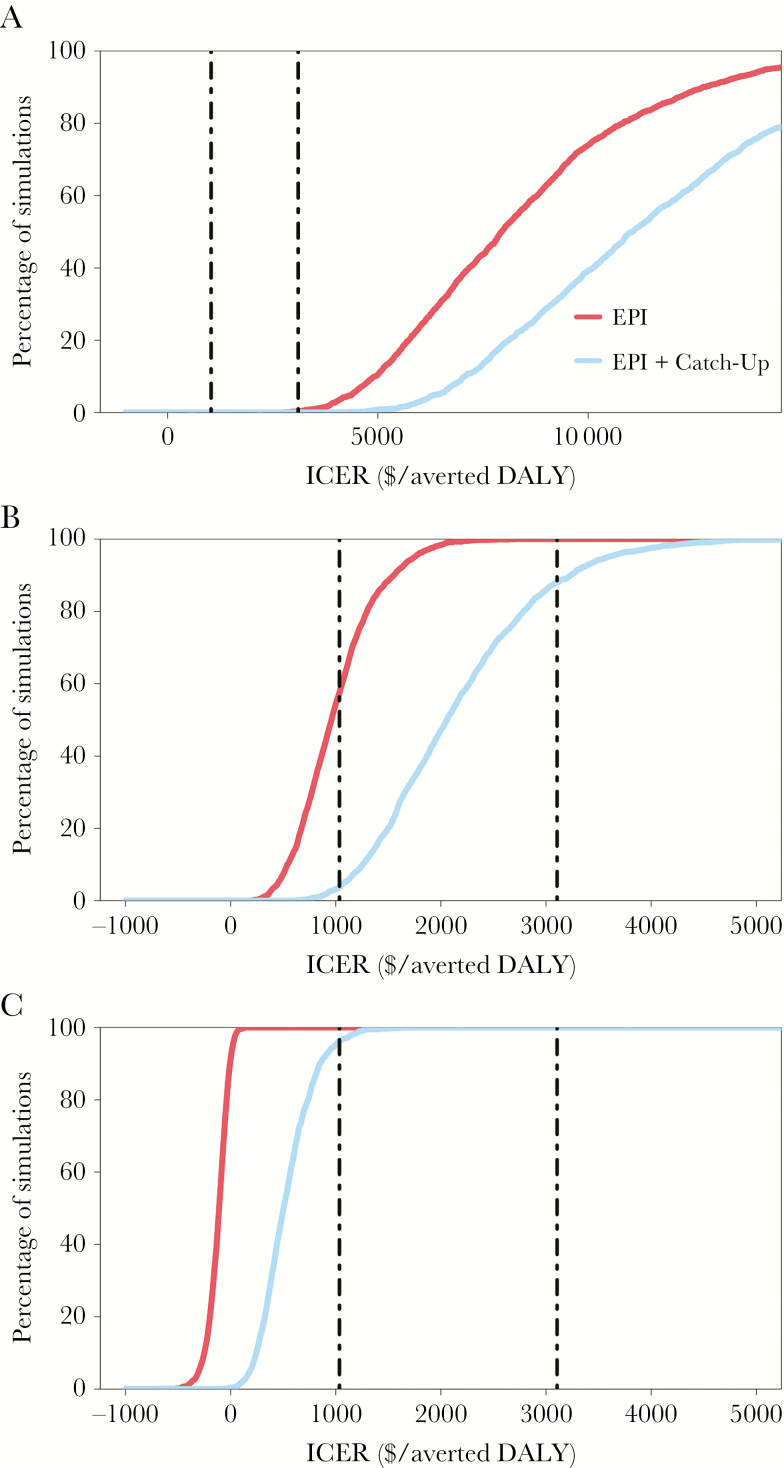
Figure 4.
Cost-effectiveness acceptability curves assessing the probability either strategy falls below the willingness-to-pay threshold. We used a probabilistic sensitivity analysis varying all cost, disability, and epidemiology model inputs to compute the probability of each strategy being highly cost-effective at a specified willingness-to-pay threshold ($/averted DALY). Curves are provided for 3 settings: low endemicity (10 cases/100000; A), moderate endemicity (50 cases/100000; B), and high endemicity (200 cases/100000; C). The vertical lines indicate 2 commonly used willingness-to-pay thresholds of 1 times the gross domestic product (GDP) per capita ($1035/averted DALY; left) and 3 times the GDP per capita ($3105/averted DALY; right). A negative incremental cost-effectiveness ratio (ICER) reflects a cost-saving strategy. Note that the low-incidence setting (A) is graphed across a wider x-axis scale as compared to settings of moderate and high endemicity.

