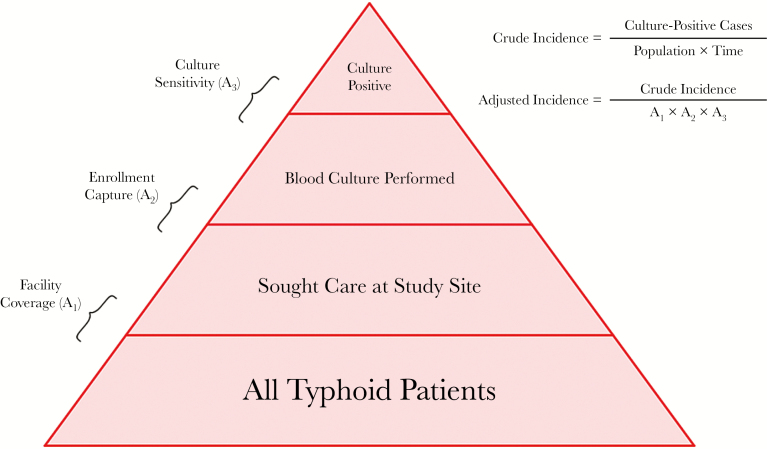
Figure 1.
Typhoid disease pyramid, where the base represents all typhoid patients in a catchment area and the apex represents culture-positive cases detected at study sites. Culture sensitivity is estimated from the literature, enrollment capture is estimated at facilities, and facility coverage is estimated by a household survey. These factors are utilized to adjust the crude incidence.

