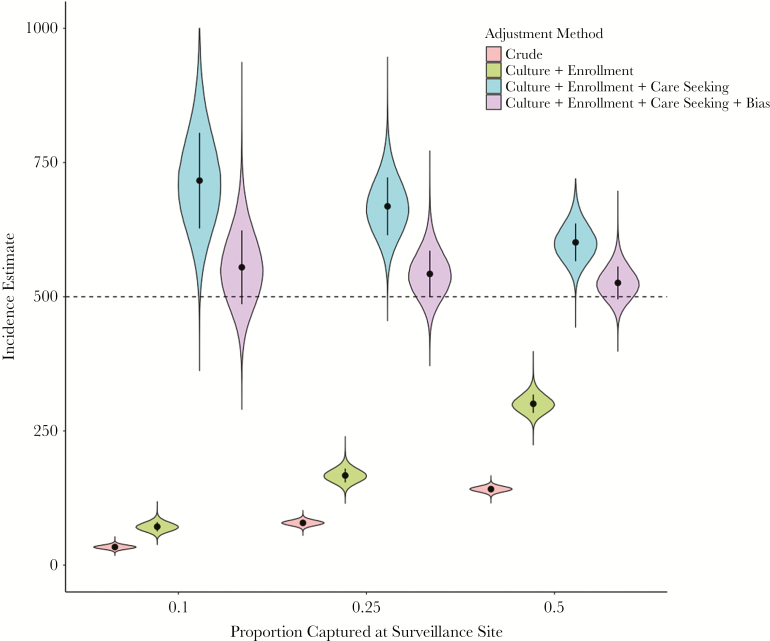
Figure 5.
Incidence estimates and uncertainty intervals according to adjustment method and proportion captured at the surveillance site. We assume 1 year of surveillance in a population of 100000 individuals with typhoid incidence of 500 per 100000, a healthcare utilization assessment of 5000 households, and odds ratio of care seeking at study sites for typhoid patients (bias) of 1.5. Culture sensitivity (assumed 59% [95% confidence interval, 54%–64%]); proportion of eligible individuals at study site enrolled (assumed 80%); adjustment for care seeking (varied, x-axis); bias: adjustment for biases in healthcare seeking (correction of 67% of bias). The dashed line represents the true prevalence.

