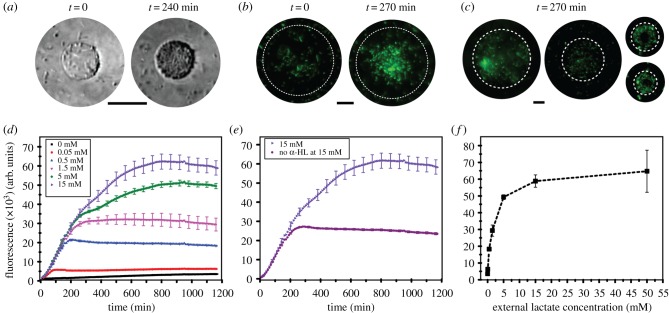
Figure 4.
Full operational system showing the hybrid lactate biosensor. (a) Bright field images showing encapsulated microbes in vesicles over 240 min. Scale bar, 20 µm. (b) Fluorescence images of the hybrid lactate biosensor at 50 mM concentration of lactate at t = 0 and t = 270 min. Brightness and contrasts enhanced equally across the fluorescence images. Scale bar, 20 µm. (c) Fluorescence images of hybrid biosensors at 50 mM lactate concentration at t = 240 min. Scale bar, 20 µm. (d) Graph showing fluorescence intensity over time of the produced GFP at different lactate concentrations as lactate penetrates the vesicle system via the α-HL pores. The full two-step reaction cascade takes place. (e) Fluorescence signal at 15 mM lactate in the presence and absence of α-HL pores. (f) Characterization data of the hybrid biosensor at different concentrations of lactate. Error bars represent the standard deviation of five technical replicates.

