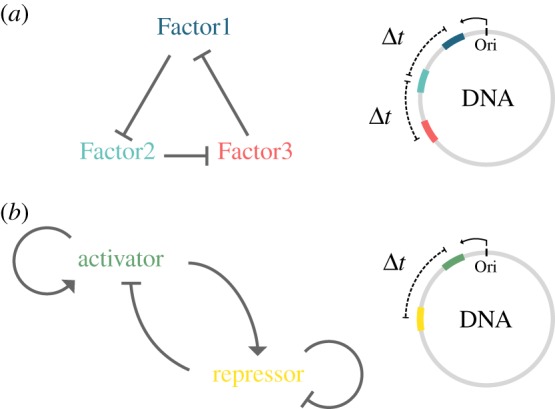
Figure 2.

Representation of two synthetic oscillators and genome integration. (a) The network architecture of the repressilator by Elowitz & Leibler [61]: Factor1 represents a protein that represses the production of Factor2, which in turn represses the production of Factor3. Factor3 acts as a repressor for the gene expression of Factor1 again. The three factors are colour coded and their location on a circular chromosome is shown on the right. The Δt represents the distance on the chromosome and thus the time difference between the replication of the genes. (b) The network architecture of the dual-feedback oscillator by Stricker et al. [62]: the activator activates its own production and enhances the production of the repressor. Whereas the repressor prevents its own production and suppresses the production of the activator. The two factors are colour coded and their location on a circular chromosome is shown on the right. The Δt represents the distance on the chromosome and thus the time difference between the replication of the genes. Ori depicts the origin of replication and the arrow indicates the direction of replication. This figure is adapted from [63] where the effects of the position on the chromosome of these two synthetic oscillators are studied in more detail.
