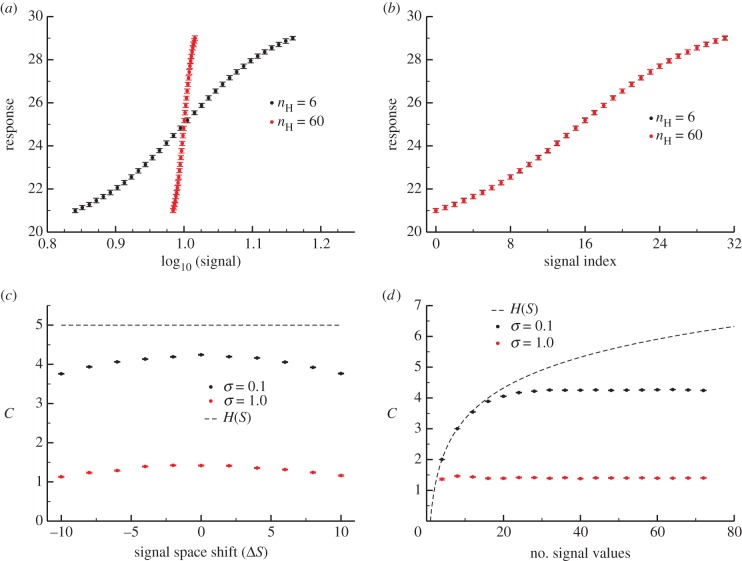
Figure 1.
Characterizing the information in a simple signalling model. Error bars in this and subsequent figures denote 95% confidence intervals in the channel capacity estimation procedure. (a) Transition zone dose–response data from the Hill function model sampled with 32 signal values for two different values of n but identical levels of noise ( ). (b) The data from panel (a) but with the signal values mapped to indices for comparative analysis. Note that while the transition zone shrinks with increasing ultrasensitivity, normalization to the width of the transition zone reveals the similarity of the two datasets. (c) Channel capacity of the simple model for two levels of noise as a function of a shifting range of signal values. In both cases, the maximum information transmission occurs when
  . (d) Channel capacity as a function of the density of signal values sampled in the transition zone. The minimum signal density for optimal information transmission depends on the noisiness of the channel. The entropy of the signal distribution is shown (black dotted line), denoting an upper bound to the channel capacity. (Online version in colour.)

