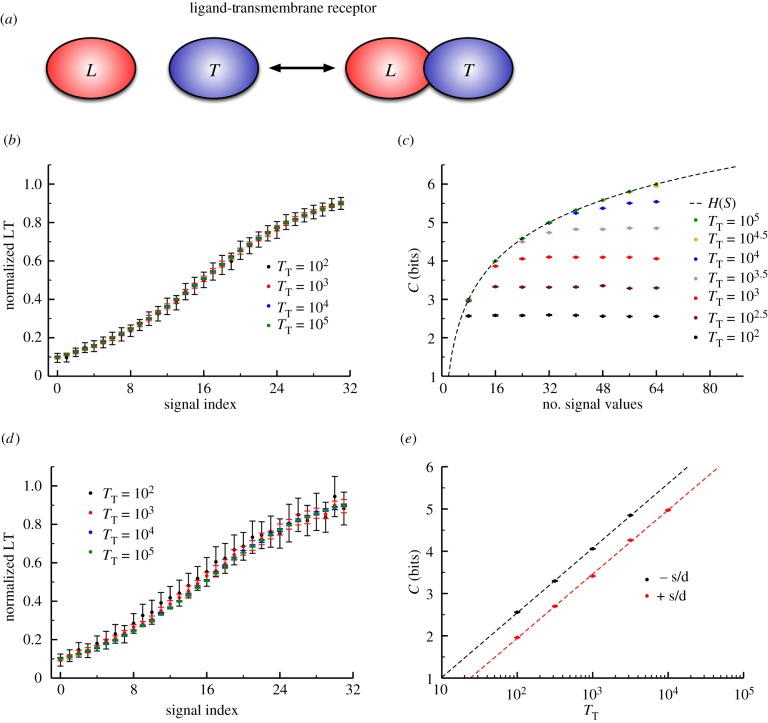
Figure 2.
(a) Schematic of the ‘ligand–transmembrane receptor’ (LT) motif. This represents a simple, reversible binary interaction between two molecules (in this case, the ‘L’ and ‘T’ molecules). While we consider this a model of a ligand binding a receptor, this could represent any reversible binding interaction in cell signalling. (b) The number of molecules in the system directly corresponds to the amount of noise in the response (which in this case is the fraction of bound receptor). (c) Similar to figure 1, we observe ‘saturation’ of information with sufficiently densely sampled signal values that depends on the level of noise in response. (d) The LT model that includes molecular turnover (i.e. synthesis and degradation of both L and T) exhibits the same trends as in (a) but the relative level of noise is higher. (e) A log-linear relationship exists between the number of molecules in the system (inversely proportional to the variability in response) and the channel capacity. (Online version in colour.)

