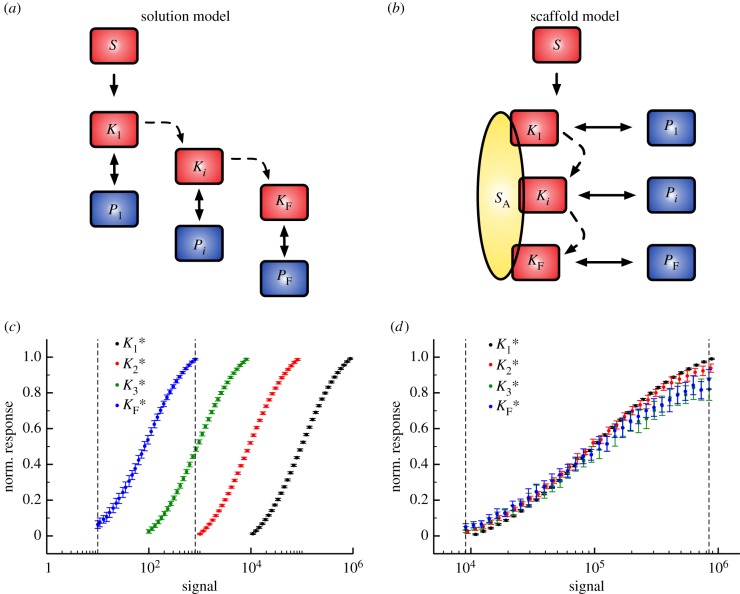
Figure 4.
(a) Solution cascade model where activation of  only depends on binding active
  . (b) Scaffold-based cascade model where activation of kinase
  depends on having active
  and
and  bound simultaneously to the scaffold, S. (c) Scaffold model dose–response trends generated using the VTZ approach (see text). The dotted lines denote the transition zone of the final kinase (which is used in the FTZ approach to generate dose–response data for all
  ). (d) As (c) but with the solution model. (Online version in colour.)

