
Figure 6.
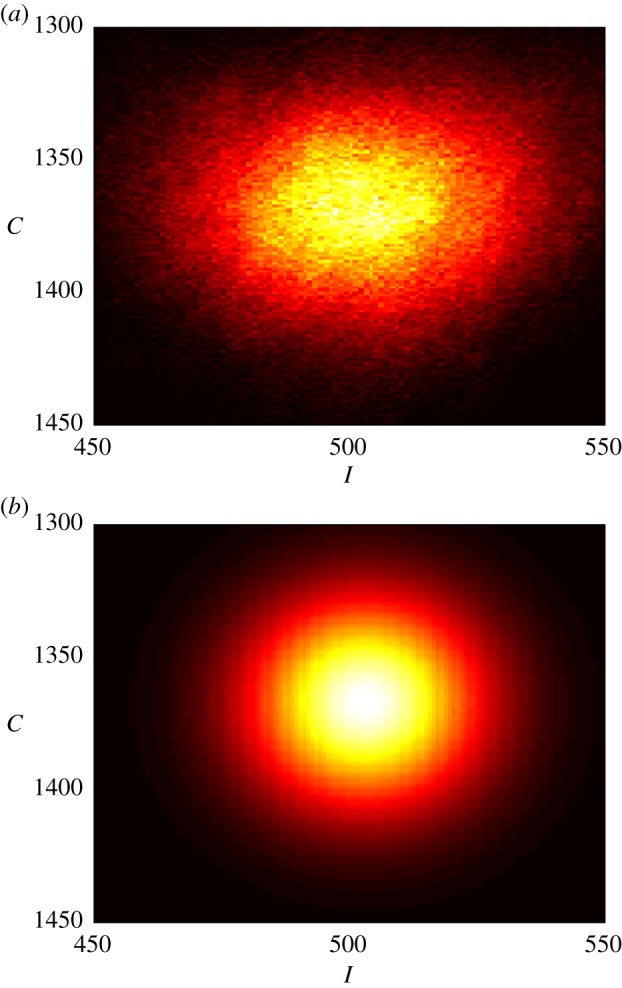
The observed (a) and the MaxEnt (b) probability density functions of the joint random variable (I, C). The probability distributions are generated from simulations with ν = 3.68 × 10⁻⁴ and δ = 1 × 10⁻³.
Official websites use .gov
A
.gov website belongs to an official
government organization in the United States.
Secure .gov websites use HTTPS
A lock (
) or https:// means you've safely
connected to the .gov website. Share sensitive
information only on official, secure websites.
The observed (a) and the MaxEnt (b) probability density functions of the joint random variable (I, C). The probability distributions are generated from simulations with ν = 3.68 × 10⁻⁴ and δ = 1 × 10⁻³.