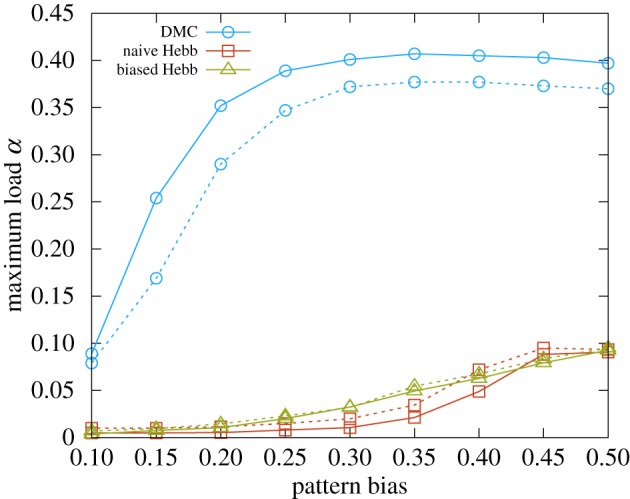
Figure 5.

Maximum storage load as a function of the bias in the distribution of the patterns for networks of size N = 200 (dashed curves) and N = 400 (full curves). The correlation is introduced trivially: each pattern is built by extracting spins from a biased distribution  . The blue curves show the scaling properties of the capacity of the DCM rule as a function of the bias. The drop in the performance for small biases is due to finite size effects, and the performance improves with N. The red and green curves show the results for the naive Hebb rule and the generalized Hebb rule adapted to the biased case, respectively (see the electronic supplementary material, section IV D). For larger N, the capacity for all unbalanced cases is expected to drop to 0. All the curves were obtained by averaging over 10 samples (error bars are smaller than the point size). (Online version in colour.)
