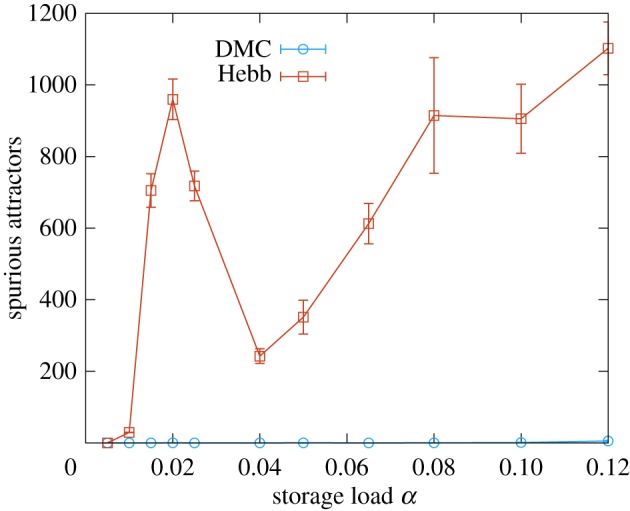
Figure 7.

Number of spurious attractors for a network of N = 400 neurons. This figure shows the number of distinct spurious attractors found during 10000 independent random walks, of 200 time-steps, after a small number of patterns were learned by the network (see the electronic supplementary material, section IV B). The red curve represents the Hebb rule (the first peak is due to finite size effects). The blue curve shows the behaviour of the DCM rule. The curves were obtained by averaging over 10 samples (error bars are standard errors). (Online version in colour.)
