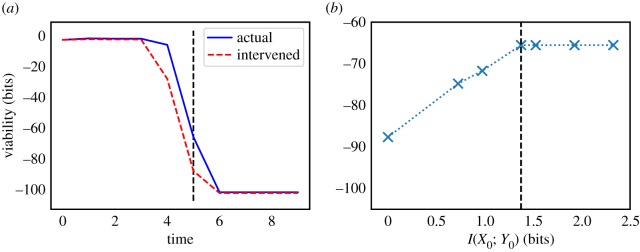
Figure 2.
Illustration of our approach using a simple model of a food-seeking agent. (a) We plot viability values over time under both the actual and (fully scrambled) intervened distributions. The vertical dashed line corresponds to our timescale of interest (τ = 5 timesteps). (b) We plot the information/viability curve for τ = 5 ( × 's are actual points on the curve, dashed line is interpolation). The vertical dashed line indicates the amount of stored semantic information. See text for details. (Online version in colour.)

