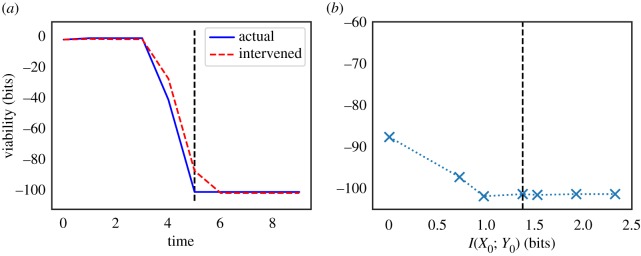
Figure 4.
Illustration of our measure with a simple model of a system which moves away from where it believes food to be located. (a) We plot viability values over time under both the actual and (fully scrambled) intervened distributions. The vertical dashed line corresponds to our timescale of interest (τ = 5 timesteps). (b) We plot the information/viability curve for τ = 5 (×'s are actual points on the curve, dashed line is interpolation). The vertical dashed line indicates the amount of stored semantic information. See text for details. (Online version in colour.)

