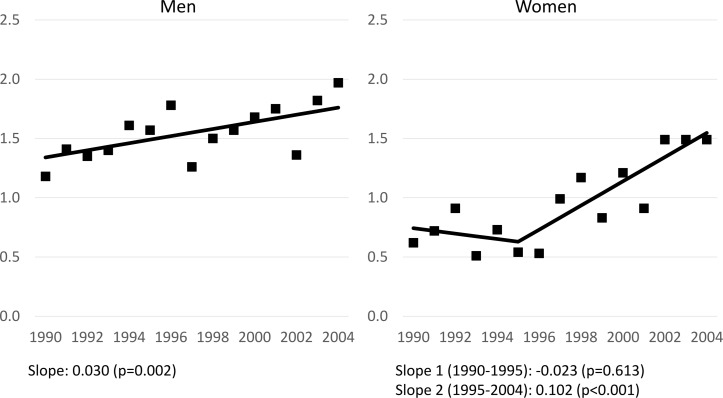
Figure 3.
Trends in relative index of inequality for income in age-adjusted suicide mortality rates in men and women. Values for slope indicate the changes in RII per year (p value) obtained from joinpoint regression. In women, there was a change in time trends, from stable (1990–1995) to increasing (from 1995).

