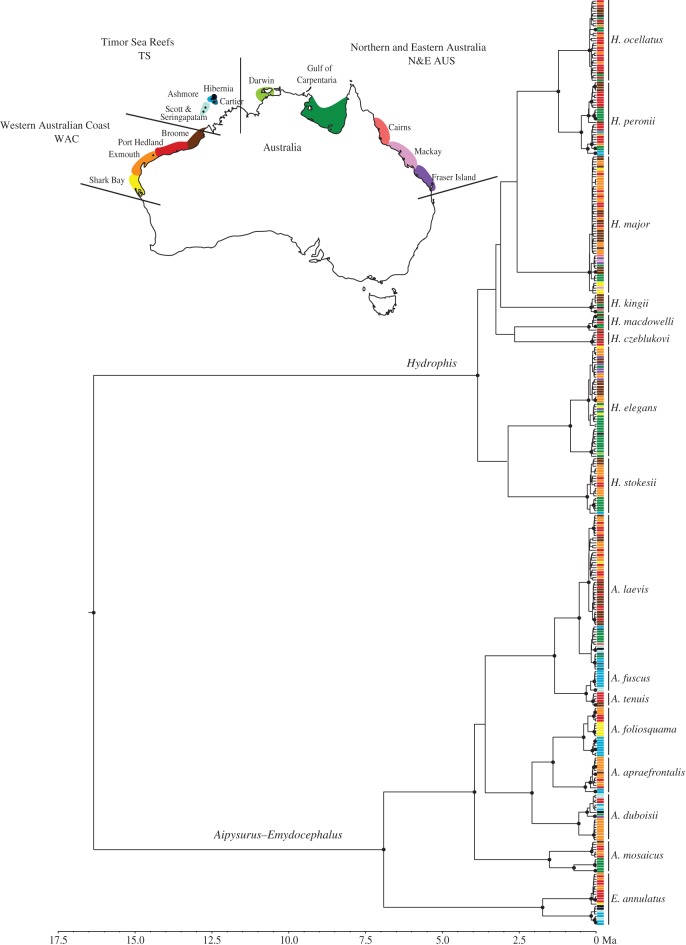
Figure 1.
Mitochondrial maximum clade credibility tree for all 16 sampled species. Sampling localities are shown as colours and correspond to the map. Timescale is in millions of years ago (Ma). Posterior probability support values greater than 0.95 are shown as black dots. (Online version in colour.)

