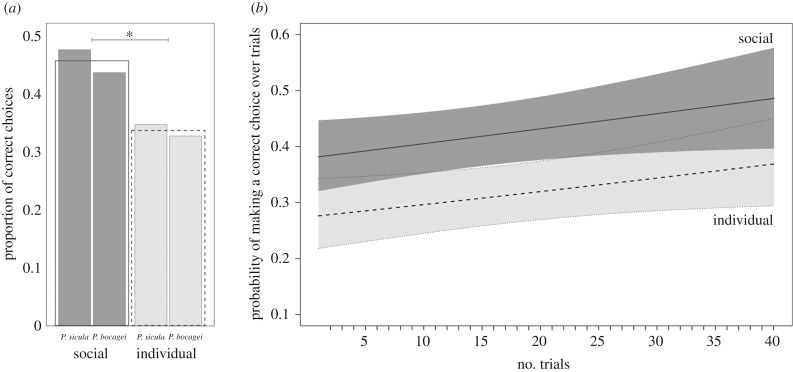
Figure 2.
The proportion of correct choices during the task (a), and the probability of making a correct choice across 40 trials (b). Social treatment is represented in dark grey (solid lines), and the individual treatment in light grey (dashed lines). In (a), the outlined bars show treatment average of raw data, whereas the shaded bars are demonstrator-specific treatment averages. In (b), we plotted data predicted from models; shaded polygons on either side of the fitted lines are 95% CIs.

