Figure 1.
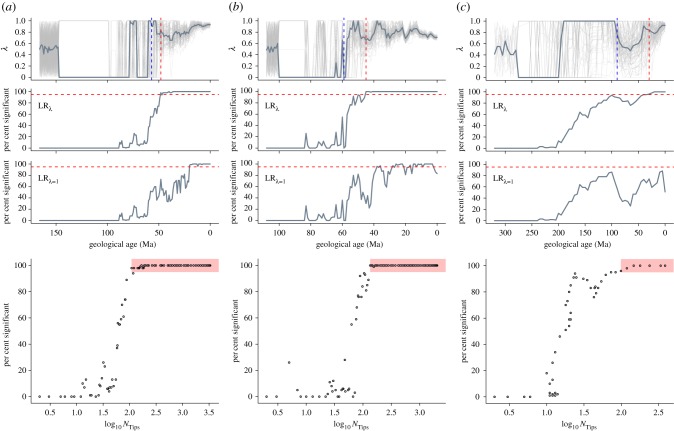
Phylogenetic signal in rates of trait evolution through time. Phylogenetic signal (λ) was estimated across time-sliced phylogenetic trees (top row) in three independent datasets: (a) mammalian body mass, (b) avian beak shape and (c) amniote bite force. Faint lines represent each of the 100 samples with the bold line representing the median λ. The percentage of the sample in which LRλ (likelihood ratio between GLSλ and GLSλ=0) was significant is shown for each time slice (second row). Further, the fit of GLSλ=1 is shown as the percentage of the sample in which LRλ=1 (likelihood ratio between GLSλ=1 and GLSλ=0) was significant for each time slice (third row). Red dashed lines represent the 95% threshold. Blue dashed lines (top panels) represent the time slice for the 95% threshold as determined through simulations (electronic supplementary material figure S3). The relationship between the percentage of significant λ and NTips (bottom row) shows a clear drop off in the percentage from 95% of the sample (red shaded box).

