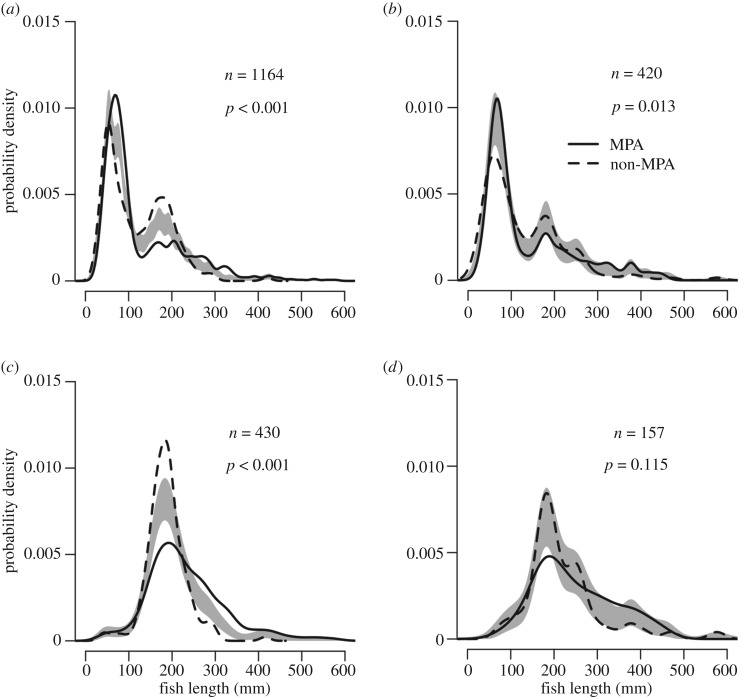
Figure 6.
Fish length distributions for all fish species for (a) shallow reefs, (b) MCEs and for commercially important fish species only for (c) shallow reefs and (d) MCEs. The grey-shaded area indicates one standard error either side of the null model of no difference in length distribution based on protection. n = number of fish.

