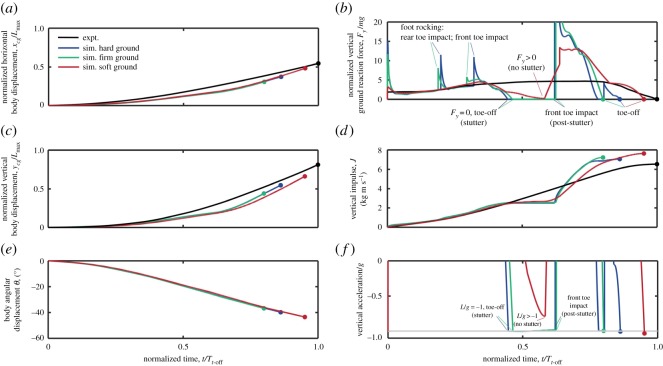
Figure 11.
Time histories of body kinematics and dynamics from simulations (blue, green and red) and experimental measurements (black) of a jumping guinea fowl, Numida meleagris. Results are plotted against time normalized by the toe-off time for the experimental measurements, Tt-off; circular symbols highlight the toe-off time for each case. Simulations are shown for three different ground contact stiffnesses, with the ‘soft’ and ‘hard’ ground contact stiffnesses of 2 kNm−1 and 80 kNm−1, respectively, taken from previous models of robotic terrestrial locomotion [47], and the ‘firm’ stiffness of 40 kNm−1 taken from previous simulations of human walking [46]. Body linear and angular displacements are plotted relative to the position in the crouch posture as defined by [2]. Linear displacements are normalized against the maximum leg length, Lmax, given as the sum of four leg segment lengths. See also electronic supplementary material, videos S7 and S8. Light grey horizontal line in (f) represents the limiting case of vertical acceleration equal to –g.

