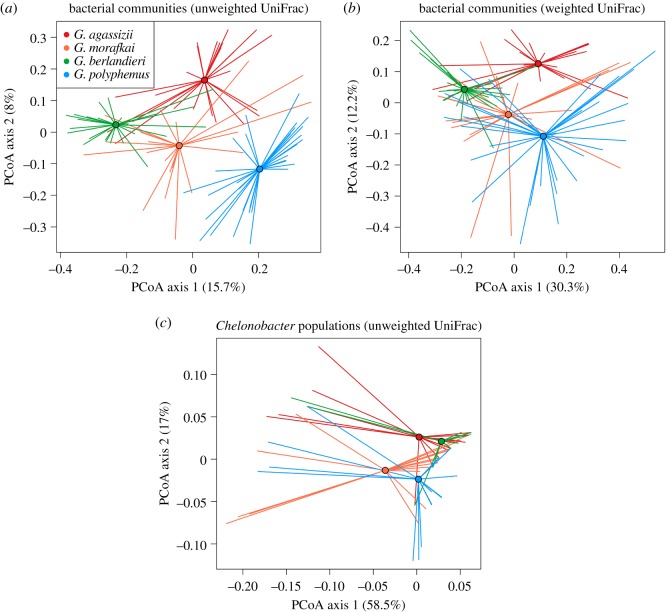
Figure 3.
Principal coordinates analysis of nasal bacteria in four North American Gopherus tortoise host species. (a) Communities from 600 sequences per sample based on unweighted UniFrac distances. (b) Communities from 600 sequences per sample based on weighted UniFrac distances. (c) Diversity of Chelonobacter populations in tortoise host species. (a–c) Colour-coded by host species: red = G. agassizii; orange = G. morafkai; green = G. berlandieri; blue = G. polyphemus. Mean PCoA coordinates for each species are denoted by circles with vectors connecting means to individual points.

