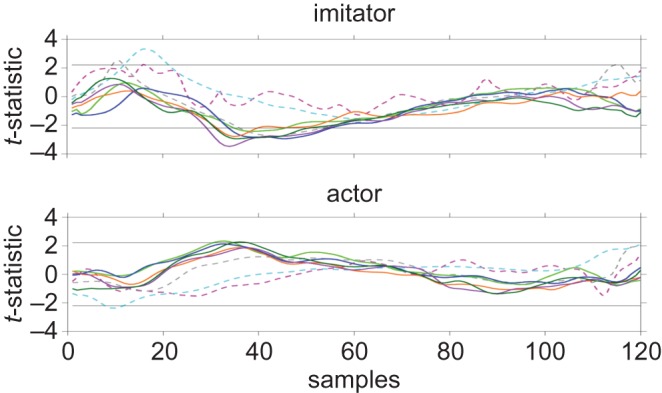
Figure 4.

t-statistic plots for site * time interaction in all trackers. Horizontal lines indicate positive and negative critical t-values; Dashed magenta, shoulder; dashed cyan, elbow; dashed grey, wrist; light green, thumb; blue, index finger; orange, middle finger; purple, ring finger; dark green, little finger.
