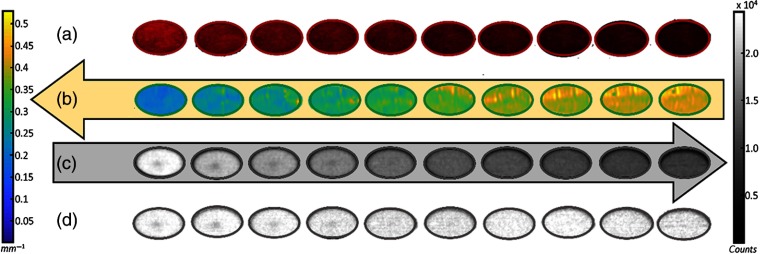
Fig. 3.
(a) An observable increase in effective attenuation follows a series of 5% to 24% blood concentrations (first row) where blood is a known optical light absorber. (b) SFDI absorption and scatter maps were taken for each sample and used to create effective attenuation maps using the expression in Eq. (1). (c) The respective CIs illustrate the reduction in Cherenkov light with increasing . (d) Once the correction has been applied, the average value of each well equalizes to counts with a standard deviation of 879 counts, . The decreased Cherenkov intensity in the center of each well is an artifact due to the stir pellet.

