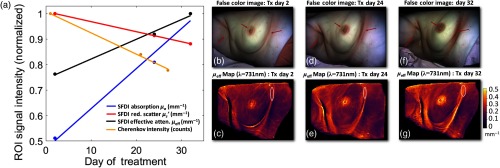
Fig. 7.
(a) The breakdown of changing tissue optical properties in Patient 1, which are normalized and plotted over the course of one month of treatment (beginning, middle, and end), where SFDI data are taken at days 2, 24, and 32, and Cherenkov at days 1, 21, and 27. The region analyzed is indicated by a red circle in the mammary fold in the bottom row of effective attenuation maps (c), (e), and (g). Absorption in this region increases by 49%, and reduced scatter decreases by 13%, yielding an overall effective attenuation change of . Measured Cherenkov emission, conversely, decreases by . Although these changes are not illustrated in full-color format, the false-color images reconstructed using the NIR wavelengths employed by the reflect RS clearly indicate the changes incited around the mammary fold, as well as those in the axillary fold and the nipple-areola complex (b), (d), and (f).

