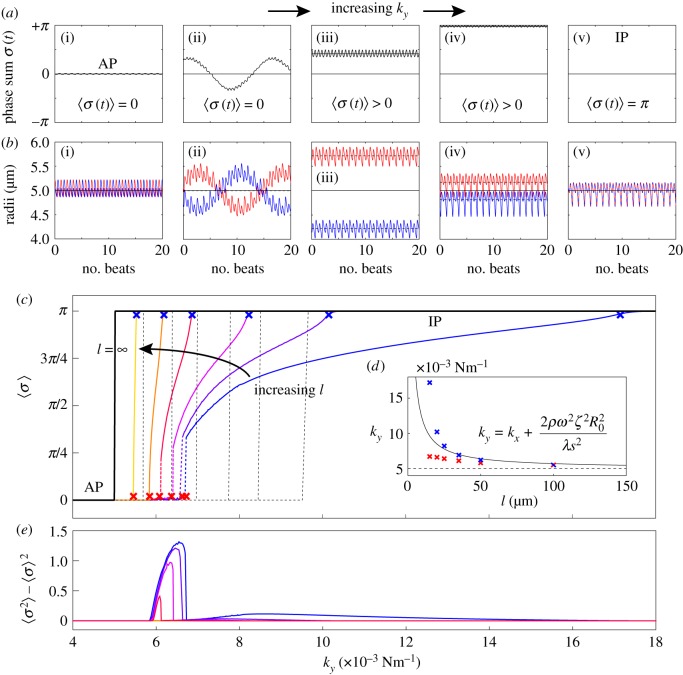
Figure 5.
Basal body coupling and hydrodynamic interactions. (a) Steady state phase sum  and (b) external radii
  and
and  . Results are shown for
  , 0.006, 0.007, 0.017,
  with
with  and
and  . For intermediate values of ky, the external rotors display a permanent difference in their average radii despite being identical. Electronic supplementary material movies 1–5 show the dynamics for (i)–(v), respectively. (c) Value of
  as a function of ky for various values of l (results shown for
  , 20, 25, 35, 50,
  ). The transition zone boundaries are quantified by
  (red crosses) and
  (blue crosses) respectively; dashed black lines show far-field analytical predictions to leading order (from equation (4.1)). (d) Measured boundaries compared with leading order far-field analytical results. (e) The variance of the time-dependent phase sum,
  , for given values of ky and l, reveals large excursions in the phase sum prior to the bifurcation (see (a(ii)) for the raw time-dependent signal). (Online version in colour.)

