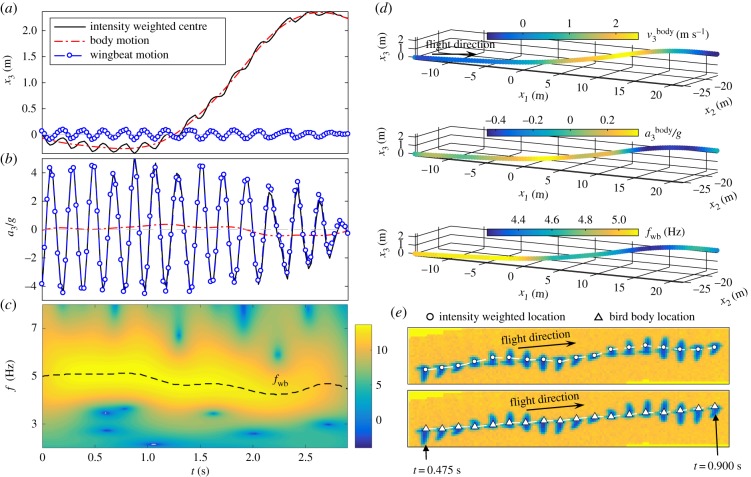
Figure 3.
(a) Time evolutions of  ,
,  , and
, and  . (b) Time evolutions of
  ,
,  , and
, and  . (c) Power spectrum (on a log scale) obtained from a continuous wavelet transform of
  and time evolution of fwb (dashed line). (d) The same 3D trajectory coloured by
  ,
,  and fwb. (e) Time series of bird images on one camera, along with their intensity weighted centres (top row) and 2D locations obtained by re-projecting
  onto images (bottom row). (Online version in colour.)

