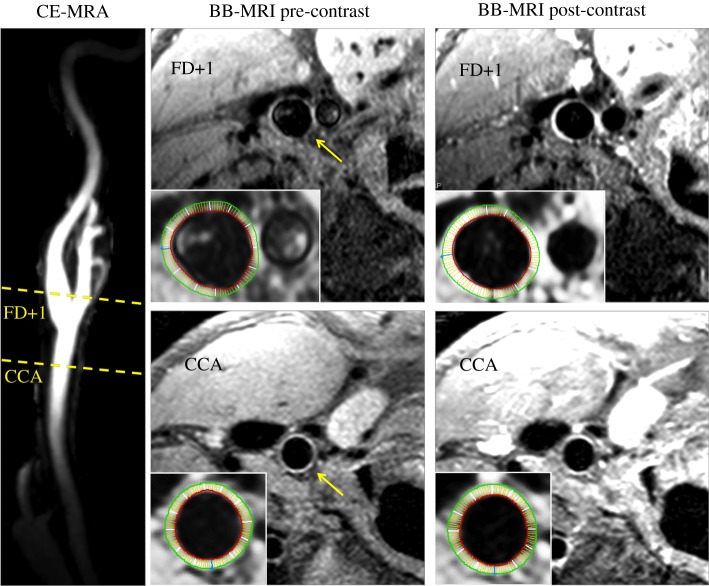
Figure 2.
Representative MRI images, showing locations of the CCA and FD + 1 slices on a maximum intensity projection of the 3D CE-MRA of the carotid bifurcation; and BB-MRI slices from those locations both pre- and post-contrast, with vessel-of-interest identified by yellow arrow. Insets show inner and outer boundaries of the segmented vessel walls, with white radial lines delineating the 12 sectors over which CE and WT were computed.

