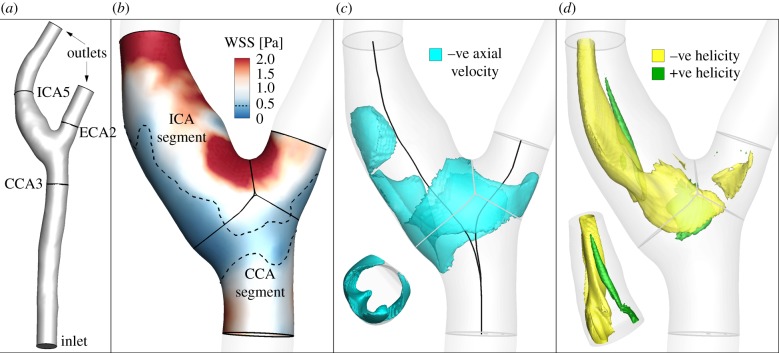
Figure 3.
Summary of haemodynamic analysis for a representative case, showing: (a) segmented lumen surface, including flow extensions for CFD; (b) the computed WSS magnitude, automatically clipped and then divided into CCA and ICA segments, with dotted line shows region of low WSS; (c) negative axial velocity, used to calculate VolRec (inset: axial view of ICA segment, showing protrusion of negative axial velocity into the lumen; –ve: negative); and (d) helical flow patterns visualized using local normalized helicity (LNH, the normalized dot product of velocity and vorticity vectors [24]; −ve: negative, +ve: positive), with signed LNH values identifying counter-rotating flow patterns (inset: rotated view of ICA segment, showing asymmetric LNH).

