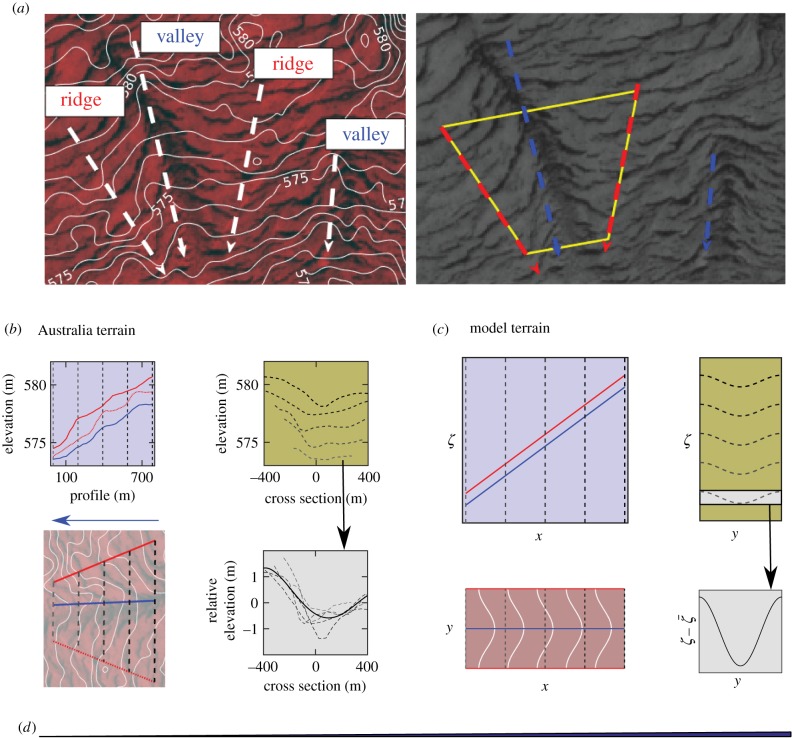
Figure 4.
(a) The left image shows elevation contours (solid white) on a section of the patterned site in figure 2d. A few approximate ridge and valley lines (white dashed) are shown with arrows pointing downhill. The yellow trapezoid in the right greyscale image indicates a typical topographic structure consisting of a valley aligned along the grade surrounded by two ridges. (b) Elevation contours for the trapezoid region in (a) are shown together with their profiles along the grade (above) and along cross sections transverse to the grade (right). A fourth-order polynomial fit (solid black) is shown for the elevation relative to the mean of the cross sections (dotted grey). Note that the profile distance is taken to be distance along the valley line and the associated ridge elevations are found by orthogonal projection. (c) Model topography given by equation (1.5) with v = 10, σ = 5, Lx = 100 and Ly = 50. Elevation contours along with cross sections show the height of ridge (red) and valley (blue) relative to the change in elevation that results from uniform slope along x. Note that the scale for elevation in (a) and (b) is greatly exaggerated relative to the x- and y-dimensions. (d) For reference, the triangle at the bottom is drawn to scale with a 0.6% grade corresponding to the mean of the example shown in (b). (Online version in colour.)

