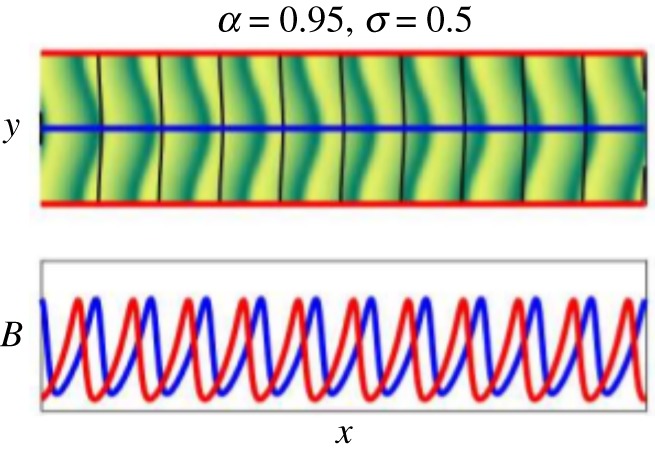
Figure 5.

Upper frame shows biomass field on the full two-dimensional domain at t = 1000 with the modestly curved elevation contours (black) superimposed. Green (yellow) on the colour scale represents high (low) biomass values. While the vegetation bands are more significantly arced than the elevation contours, the direction of curvature consistently matches across the domain for both. The lower frame shows one-dimensional profiles of the biomass along ridge (red) and valley (blue) lines. Periodic domain: Lx = 200, Ly = 50. Parameters: a = 0.95, m = 0.45, v = 10, k0 = 2π/Ly. (Online version in colour.)
