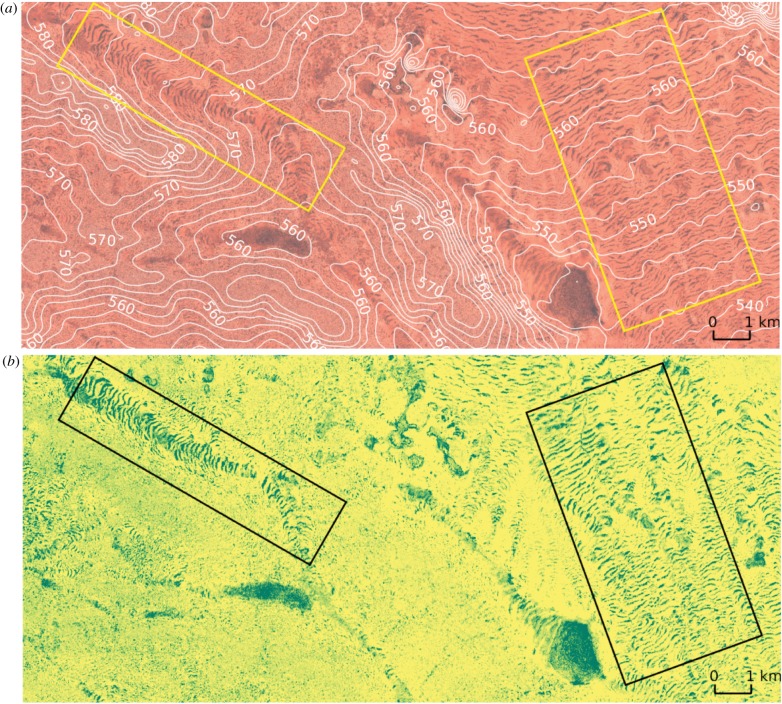
Figure 9.
Satellite image (a) and maximum NDVI (b) of a 21 km by 10 km region of Ethiopia located just east of the site shown in figure 1b. Two areas within the image are highlighted by boxes. The left is a channel aligned along a overall slope of about 0.2% grade with an approximate ridge-to-ridge distance of 3 km. The vegetation pattern, with bands arcing convex-upslope, appears within a 2 km region surrounding the valley line where the transverse elevation has a 2 m variation from minimum to maximum. The region highlighted on the right is within a broad, relatively flat valley with an overall 0.3% grade and transverse variations of less than 1 m across the 4 km width of the box. The satellite imagery comes from Sentinel 2 [28] while the elevation data are ALOS [39] with spectral smoothing [40]. The RGB image is of the least cloudy day between October 2016 and May 2017 and the NVDI shows maximum value at each pixel over the same time period. (Online version in colour.)

