Figure 5.

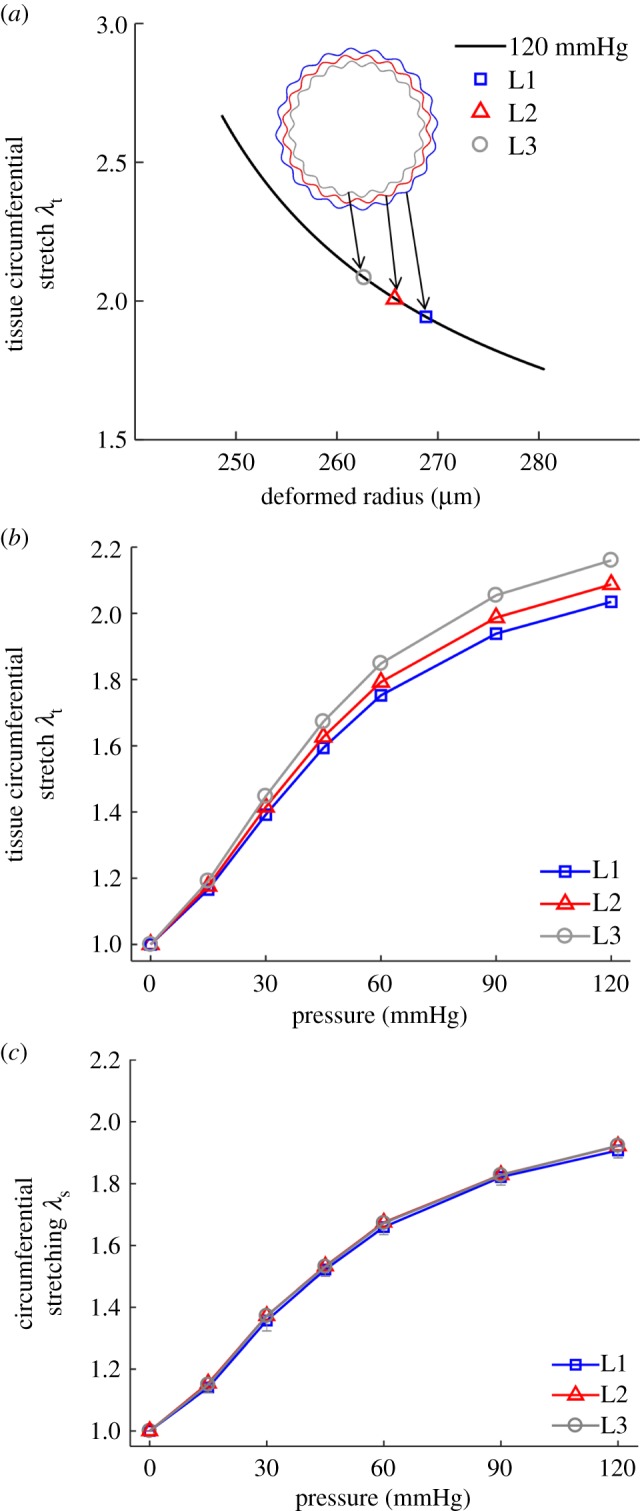
Tissue-level deformation and its relation to micromechanics. (a) Transmural circumferential stretch distribution in the arterial wall from modelling at 1.6 axial stretch and 120 mmHg pressure. Markers show the tissue circumferential stretch at the position of lamellar layers L1, L2 and L3. (b) Tissue circumferential stretch as a function of pressure at the position of lamellar layers L1, L2 and L3. (c) Lamellar stretching as a function of pressure, determined from the tissue-level deformation (b) and lamellar unfolding (figure 3d), was equivalent in all layers. (Online version in colour.)
